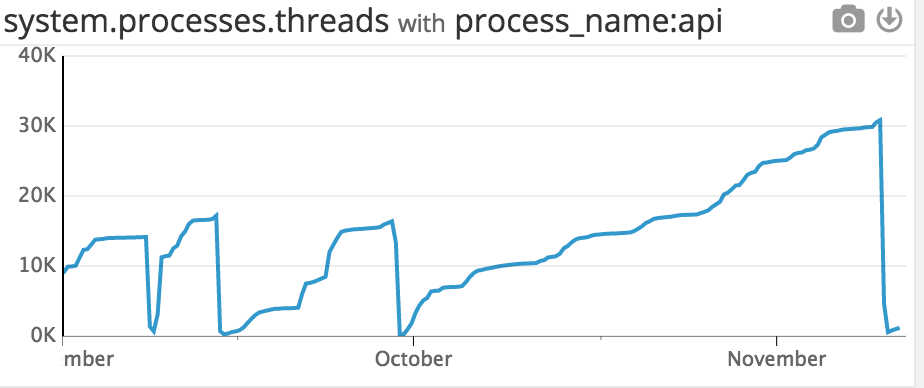
On November 10th, we suffered some downtime as our backend application mysteriously crashed and had to be restarted. After looking at our process monitoring service, I found a very suspicious graph:

Somehow, we managed to spin up more then 30,000 threads right before the application crashed. This was very likely the cause of the failure, but how did it happen?
An easy way to get an idea of where a thread leak is coming from is to look at the thread names. In Java you can do this with jstack -l $PID.
To get a list of all thread names of a Java application sorted by most common name, you can do:
jstack -l $PID | grep daemon | awk '{ print $1 }' | sort | uniq -c | sort -nr
Which on our end yielded something like this:
  30000 "Analytics"
      2 "Datomic
      2 "C2
      1 "worker-4"
      1 "worker-3"
      1 "worker-2"
      1 "worker-1"
      1 "Timer-0"
      1 "Thread-5"
      1 "Thread-4
      1 "Thread-3
      1 "Thread-2
      1 "Thread-1
      1 "Thread-0
Hmm…
Background
Our backend is written in Clojure and we use Stuart Sierra’s component framework to manage most of our application’s state and lifecycle. Normally this should prevent runaway threads, but unfortunately for us our analytics client’s state was managed independently of the framework. To explain why, I need to first delve a little in to how component works.
Regardless of how beautiful and functional it may be, any application that talks to the outside world will need to manage some state representing these external resources. We need to manage our database connections, our clients for external APIs, our background workers, etc.
One way to deal with this in Clojureland is to create a global singleton object for representing each stateful piece, possibly wrapped in an atom. This feels lacking, though. You still need a way to initialize all these singletons on startup, and having mutable singletons everywhere goes against what I would consider good Clojure style.
Component solves this problem by implementing dependency injection in a Clojurelike way. You define a graph that represents each stateful piece, how they depend on each other, and how each piece starts and stops. On system start, component boots each piece in the right order, passing along references to dependencies when they’re needed.
For example, Appcanary’s dependency graph looks (something) like this:
(defn canary-system
  []
  ;;Initialize logging
  (component/system-map
   :datomic (new-datomic (env :datomic-uri))
   :scheduler (new-scheduler)
   :mailer (component/using  (new-mailer (env :mandrill-key))
                             [:datomic :scheduler])
   :web-server (component/using (new-web-server (env :http-ip) (Integer. (env :http-port)) canary-api)
                             [:datomic])))
The mailer depends on datomic and the scheduler, the web server depends on datomic, and both datomic and the scheduler don’t depend on anything.
Like all the other components, the new-datomic function is a constructor for a record that knows how to start and stop itself. On system start, all the components are started, and the dependencies are filled in.
Sometimes component feels like overkill
Component is great, but it didn’t fit our analytics engine usecase. We use segment.io to handle our app analytics, and we needed to maintain a client to talk to it. An analytics event can potentially be called from anywhere in the app, but it’s cumbersome to pass an analytics client reference to every component, and into every analytics call. If every component depends on something, it feels like maybe it should be a global singleton. Futhermore, I don’t want my components to know much about the analytics client at all; I just want them to know how to trigger events.
What I want to have is an analytics namespace which contains all the events I may want to trigger, and wraps the client inside all of them. This lets me do something like (analytics/user-added-server user) inside of the code that handles server creation.
(One thing to note is that while there is a clojure segment.io client, it’s based off a 1.x release of the underlying java library, while we wanted to use features only available in the 2.0 release. Because of that, I wrote an analytics namespace that called the java library directly).
The first pass of creating the client looked something like this:
(defonce client
  (.build (Analytics/builder (env :segment-api-key))))

(defn track
  "Wrapper for analytics/track"
  [id event properties {:keys [timestamp] :as options}]
  (when (production?)
    (.enqueue client
              ;; Java interop to build the analytics message here)))
There’s only one problem with the above code: the segment api key is loaded from an environment variable.
We deploy appcanary in a pretty standard way – we compile an uberjar and rsync it to the server. API keys live in environment variables, and the production API key is only going to live on the production server. So, at compile time, we have no way of knowing what the segment api key is. As a result, the analytics client needs to be built at runtime and not compile time in order to have access to the api key.
This is where I get lazy
The obvious thing to do to build the analytics client at runtime is to wrap it as a function:
(defn client
  []
  (.build (Analytics/builder (env :segment-api-key))))

(defn track
  "Wrapper for analytics/track"
  [id event properties {:keys [timestamp] :as options}]
  (when (production?)
    (.enqueue (client)
              ;; Java interop to build the analytics message here)))
I saw three downsides here:
- We’ll lose some efficiency from not reusing the TCP connection to segment.io
- It’s possible that we’ll have to waste a bit of time authenticating the analytics client on each call
- We’ll spawn an extra client object per call, which will be garbage collected right away as it goes out of scope immediately after the
track call
The above three things aren’t intrinsically bad, and it seemed like optimizing the performance of your analytics engine early on was a wasteful thing to do in a fast-paced startup environment.
What I didn’t consider is that the java library uses ExecutorService to manage a threadpool, and shutdown must be called explicitly. Otherwise, the threads are put on hold instead of being marked for GC (see also this stackoverflow).
The fact that each client spawns a thread that isn’t cleaned up by garbage collection was not documented unfortunately.
Outcome
Every analytics call we made spawned another threadpool, which caused the thread count to grow proportionally with user activity. We hit 40,000 threads before our application crashed.
TL;DR:
We spawned a new client object on every analytics call, not realizing that the underlying library uses a thread pool that’s not shutdown on garbage collection. This is how we ended up killing the server by hitting 40,000 threads

